
In the previous tutorial, “Python Crawler to Get Stock Data and Save to Time-Series Database InfluxDB”, we used InfluxDB to store NVDA’s daily stock data and performed all other operations through APIs. Actually, InfluxDB has a perfect partner – Grafana. With Grafana, data can be displayed visually, making it easier to spot stock price trends at a glance.
Grafana is like a “data visualization whiz”. To put it simply, it turns a bunch of boring numbers and data into intuitive and nice-looking charts and dashboards.
For example, data from your home’s electricity meter, the operating status of your company’s servers, or even the price changes of stocks you’re following – as long as this data can be collected, Grafana can turn it into line charts, bar charts, gauges, and various other styles, letting you see trends and patterns at a glance.
It’s like a “data makeup artist”. No matter where your data comes from – databases, server monitoring tools, or other places – it can take it in and present it in the easiest-to-understand way, so you don’t have to stare blankly at a bunch of numbers.
What’s more, it’s super flexible. You can drag and drop to adjust chart styles, set up alerts (like getting automatically notified when a server has a problem), and even combine multiple charts into a “data dashboard” for one-stop viewing of all important information.
In short, it’s a tool that turns “incomprehensible” data into “easy to understand at a glance” !
Installation
The most convenient way to install Grafana is through Docker. First, make sure you have Docker installed on your machine. If not, use the following command to install it:
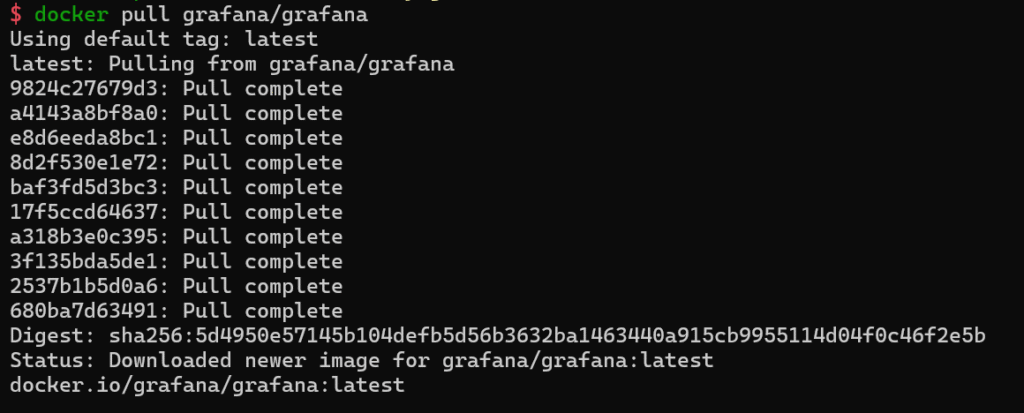
sudo apt install -y docker-ceThen pull the latest Grafana image:
docker pull grafana/grafanaIf you want a specific version of Grafana, you can use this command:
docker pull grafana/grafana:9.5.2Wait a moment and the Grafana image will be downloaded.
image
Create and start the Grafana container
To ensure data persistence (so that configurations and data aren’t lost when the container is deleted), it’s recommended to create a local directory and map it to the data directory inside the container:
# Create a local directory for persistently storing Grafana data.
mkdir -p ~/grafana/data
sudo chmod 777 ~/grafana/data  # Grant permissions (the user inside the Grafana container is non-root)


docker run -d \
  --name=grafana \
  -p 3000:3000 \  # Map ports (host port:container port)
  -v ~/grafana/data:/var/lib/grafana \  # Mount the data directory
  --restart=always \  # Start automatically on boot
grafana/grafan- – Parameter explanations:
-d: Run the container in the background--name=grafana: Specify the container name asgrafana-p 3000:3000: Grafana’s default port is 3000, mapped to the host’s 3000 port-v: Mount the host directory~/grafana/datato/var/lib/grafanainside the container (stores dashboards, user configurations, etc.)--restart=always: Ensure the container starts automatically after the host restarts
**Access the Grafana Web UI **
- Open a browser and visit
http://your-server-IP:3000(if it’s a local server, you can visithttp://localhost:3000). If you deployed it using Docker in WSL’s Linux and want to access the Docker address in WSL from outside Windows, runifconfigin WSL, find the “eth0” network card address (usually starting with 172), then in Windows’ browser, visithttp://172.x.x.x:3000. - For the first login, use the default account:
- Username:
admin - Password:
admin
- After logging in, you’ll be prompted to change the default password. Just follow the prompts to set a new one.
The homepage of Grafana after deployment is very nice.
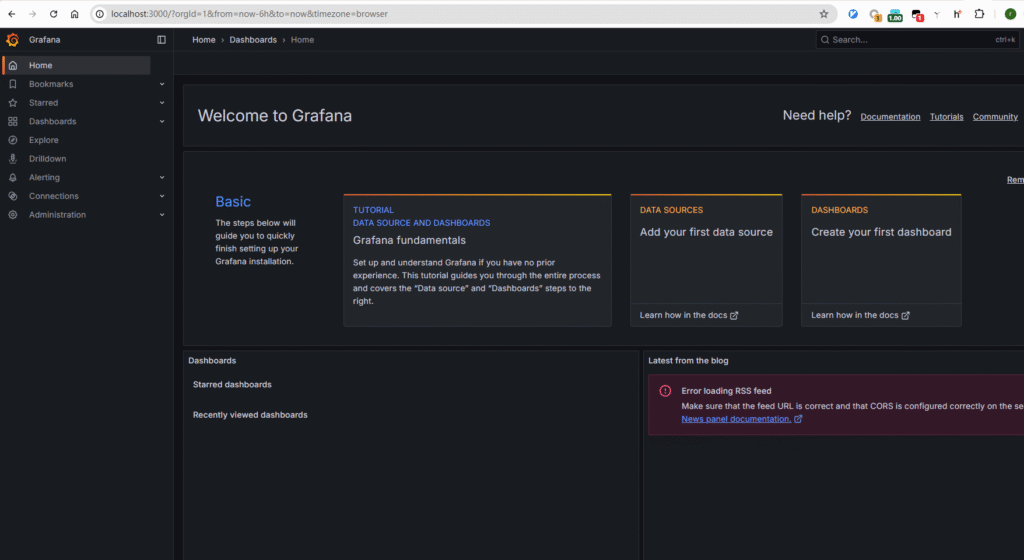
This means Grafana is running correctly.
Now, we can connect to our InfluxDB data.
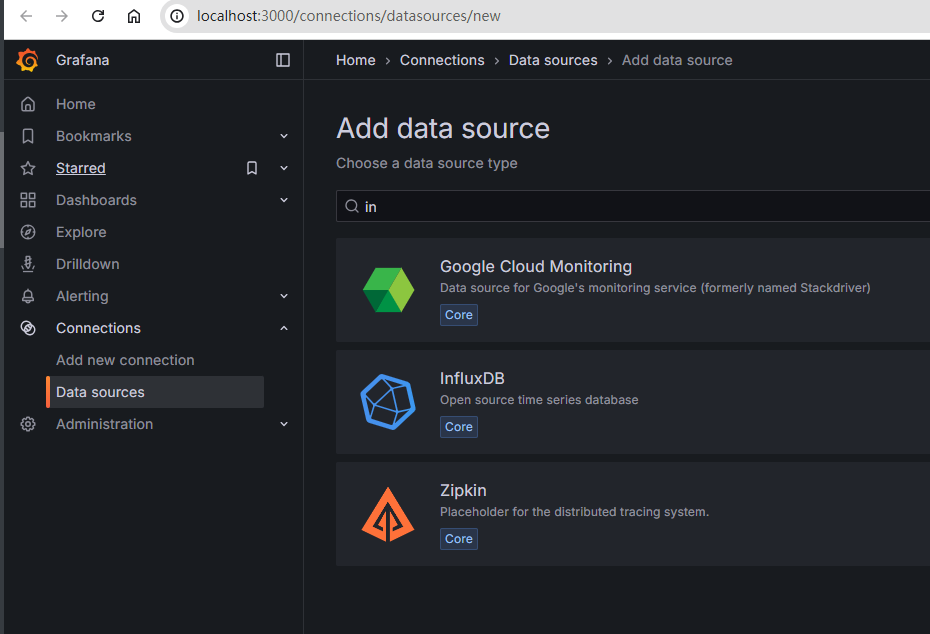
Select InfluxDB, then fill in your InfluxDB URL path, which defaults to http://localhost:8086. For the database, select db_stock which we set earlier. If you forgot, you can check our previous article: “Python Crawler to Get Stock Data and Save to Time-Series Database InfluxDB”.
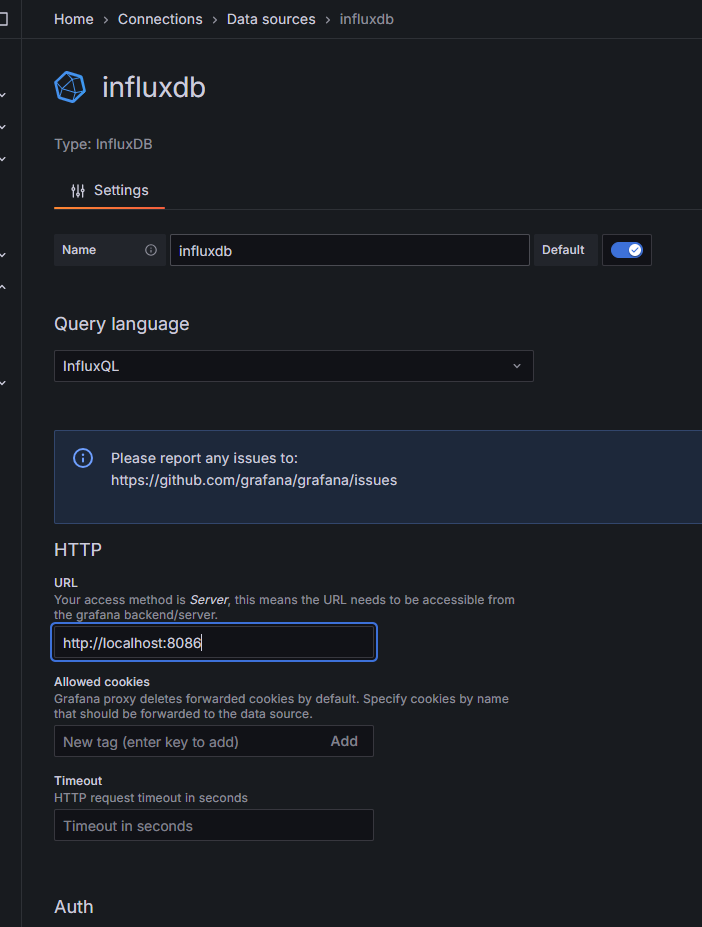
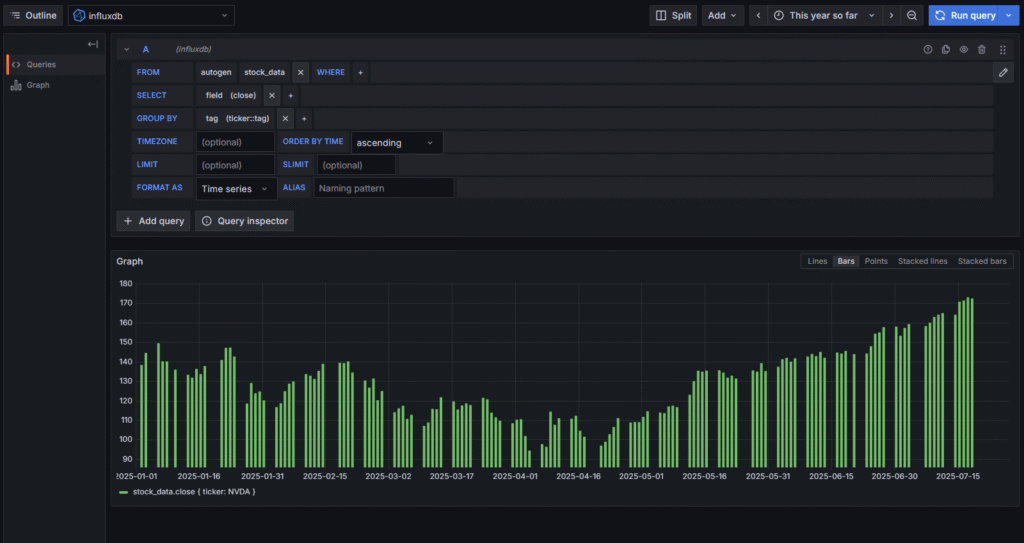
Then proceed to the next step and fill in the data of the table we want to display. In InfluxDB, tables are called measurements, here it’s stock_data. For group by, select the stock name to categorize by stock name.
Since InfluxDB is a time-series database, you need to specify a time range to display the corresponding data.
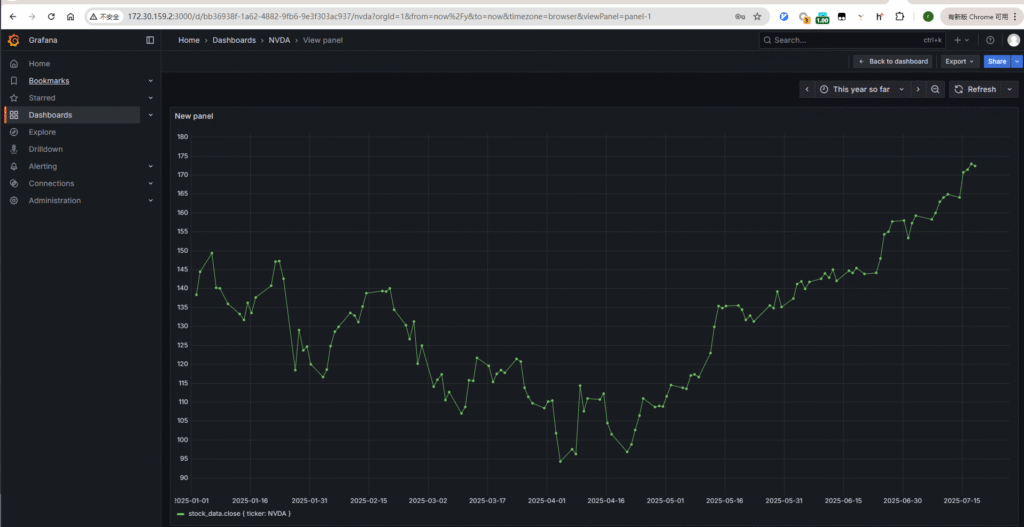
For example, we stored the daily price data of the big bull stock NVIDIA (NVDA), so we select this year’s data (This year so far).
Then refresh, and you’ll see NVDA’s price trend over the past year.
You can also switch to different data display forms easily. Like bar charts, point charts, stacked charts, etc. Just click to switch.
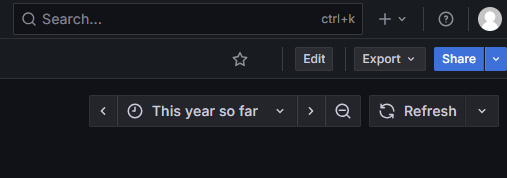
Grafana makes it easy to switch between different monitoring time periods.
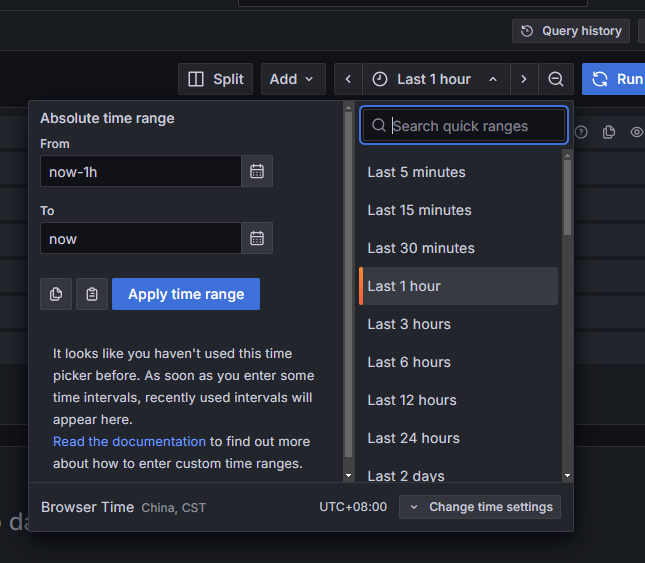
For example, if your program is continuously collecting NVDA’s stock price in the background, getting one-minute data and saving it to InfluxDB every minute, you can monitor NVDA’s stock price fluctuations in real-time on Grafana.
In InfluxDB, it’s convenient to aggregate daily data into weekly, monthly, or yearly data.
For example, the following code can convert NVDA’s daily data to weekly data:
SELECT last("close") AS "MONTHLY_PRICE"
FROM "stock_data"
WHERE
  "ticker" = 'NVDA'
  AND $timeFilter
GROUP BY time(1w)
FILL(none)
Refresh in Grafana
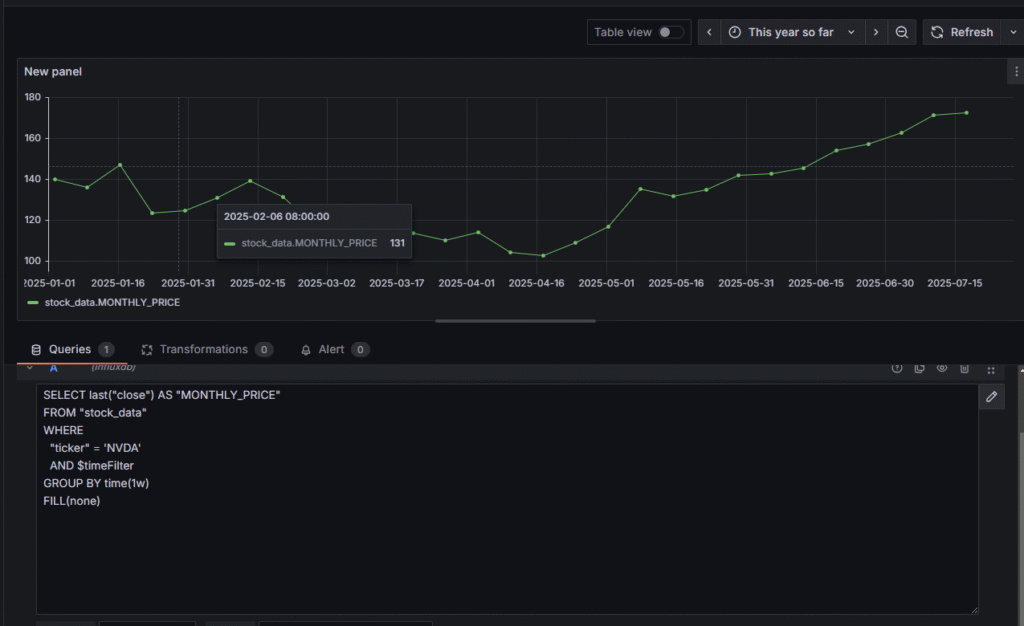
And the original daily data is converted to weekly data. InfluxDB 1.x uses the InfluxQL language.
In InfluxQL, time period units must use the following abbreviations; custom units aren’t allowed:
- Seconds:
s(e.g.,10smeans 10 seconds) - Minutes:
m(e.g.,5mmeans 5 minutes) - Hours:
h(e.g.,1hmeans 1 hour) - Days:
d(e.g.,7dmeans 7 days) - Weeks:
w(e.g.,1wmeans 1 week) - Months:
mo(e.g.,1momeans 1 month; note it’smonotmormonth) - Years:
y(e.g.,1ymeans 1 year)
Alert Notifications
Setting up alert prompts for stock price data in InfluxDB in Grafana allows for automatic notifications when stock prices break through thresholds (such as a rise of more than 5% or a drop below a certain price).
This way, you can get instant email, Feishu, DingTalk, or SMS prompts when NVDA’s stock price reaches your stop-loss or take-profit level.
Here are the steps to create an alert:
- Go to the panel editing page, click the Alert (bell icon) in the upper right corner → Create Alert.
- Configure alert conditions (take “alert when closing price exceeds 10 yuan” as an example):
- Rule name: Give it a name (e.g., “600000 stock price breaks through 10 yuan”).
- Evaluate every: Check frequency (e.g., check every 5 minutes).
- For: Duration (e.g., “5m” means the alert will trigger only if the stock price exceeds 10 yuan for 5 minutes to avoid false alarms).
- Condition
Select an aggregation function like avg(), and set the threshold:
- Function:
avg()(take the average closing price over a period of time) - Comparator:
is above - Threshold:
10(unit: yuan)
- Associate query data:
- In the Query dropdown box, select the stock price query you created earlier (the query to get the
closefield).
Configure Notification Method (How to Alert You)
- First, add a notification channel in Grafana (such as email, WeChat Work, Slack, etc.):
- Go to the Grafana homepage → Alerting → Contact points → Add contact point.
- Select the notification type (e.g.,
Email), fill in the email address, and save.
- Associate the notification channel in the alert rule:
- Go back to the alert rule editing page, find the Notifications section.
- Select the notification channel you just created (like your email).
- You can customize the alert message (e.g., “Stock 600000’s closing price has exceeded 10 yuan, current price: {{ $value }}”).
Step 4: Test and Enable
- Click Test rule to test if the alert works (Grafana will simulate triggering an alert once).
- After confirming it’s correct, click Save to save the alert rule, and the rule will be enabled automatically.
Common Scenario Examples
- Excessive stock price drop: Set the condition to “closing price < 8 yuan”.
- Abnormal price fluctuation: Calculate “(current price – yesterday’s closing price) / yesterday’s closing price > 0.05” (i.e., a rise of more than 5%).
- It requires adding the calculation of yesterday’s closing price in the Flux query, which is a bit more complex but achievable.
With the above steps, when the stock price meets your set conditions, Grafana will automatically send a reminder through your configured channel (like email), so you don’t have to keep staring at the chart and monitoring the market all the time!